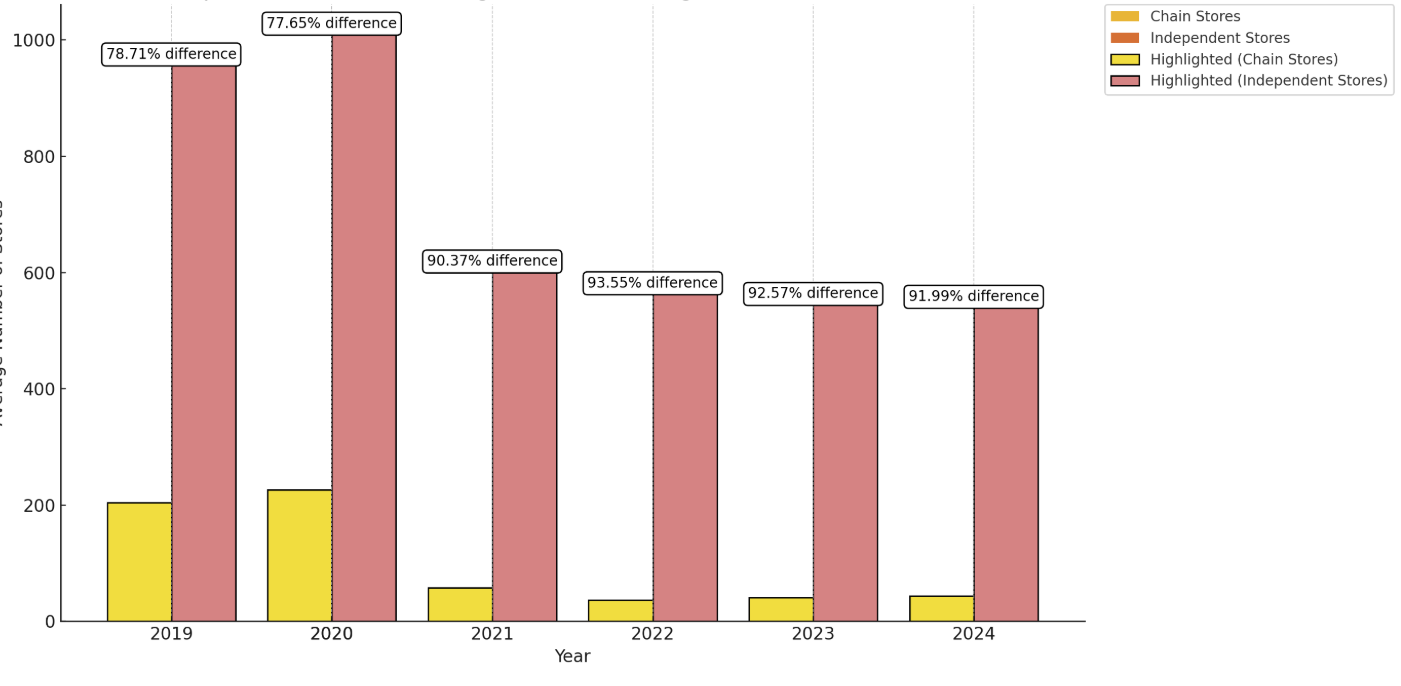
Pre-pandemic versus post pandemic percentage differences of new restaurant chain locations versus new independent openings in the
U.S.

The big drop off began in the week of March 26th, 2020. New openings were averaging 900-1,200 per week with approximately 200-250 being new chain locations. Current weekly averages are 550-650 with 40-65 new chain openings per week.
The chart represents an inverse display (465 weeks) of new openings compressed into annual representations. The brown bars display #’s of new independent openings. The yellow bars display #’s of new chain store openings in pre and post pandemic percentage differences. Current relational percentages are above 90% but improving. Pre-pandemic was a more healthy ~79%. Meaning at 79%, approximately 1 of 5 new restaurants were chain stores. Currently the percentages are around 10%.