Restaurant Openings Semi-Annual Comparison
New Restaurant Openings: Weekly Trends Since the Start of the Year
Restaurantdata continuously identifies, verifies, and delivers new and pre-opening restaurant leads to operators, suppliers and distributors across the U.S. on a weekly basis.
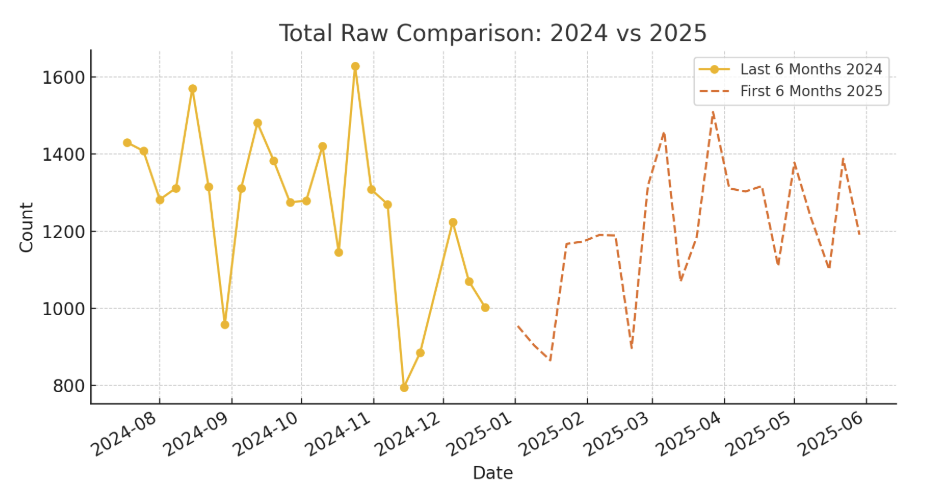
Below is a comparison of weekly opening counts across the country, contrasting the final 22 weeks of 2024 with the first 22 weeks of 2025.
Total Raw: Complete count of all filing sources prior to de-duping and vetting. Total Net: Restaurants that have been researched and confirmed to be pre-opening or post-open (no later than 2-4 months).


Results
New Openings have been steadying after data indications of a slightly downward trend in new restaurant openings, as evidenced across multiple source categories including: alcohol license applications, D/B/A and fictitious name filings, building permits, state incorporations, and LLC registrations. Total actual counts displayed:
| 1st 6 months of 2025 | |||||
| DBA’s | Incs & LLC’s | Combined Alcohol And Permits | Total Raw | Total Net Issued | |
| 5/29/2025 | 409 | 601 | 181 | 1191 | 438 |
| 5/22/2025 | 488 | 798 | 102 | 1388 | 400 |
| 5/16/2025 | 282 | 682 | 136 | 1100 | 443 |
| 5/8/2025 | 351 | 680 | 206 | 1237 | 402 |
| 5/1/2025 | 507 | 632 | 239 | 1378 | 496 |
| 4/24/2025 | 336 | 594 | 179 | 1109 | 469 |
| 4/17/2025 | 414 | 752 | 151 | 1317 | 393 |
| 4/10/2025 | 410 | 744 | 149 | 1303 | 451 |
| 4/3/2025 | 353 | 799 | 159 | 1311 | 410 |
| 3/27/2025 | 534 | 767 | 208 | 1509 | 425 |
| 3/20/2025 | 390 | 617 | 178 | 1185 | 458 |
| 3/13/2025 | 461 | 436 | 172 | 1069 | 462 |
| 3/6/2025 | 443 | 824 | 192 | 1459 | 399 |
| 2/27/2025 | 515 | 692 | 111 | 1318 | 516 |
| 2/20/2025 | 300 | 412 | 185 | 897 | 307 |
| 2/13/2025 | 409 | 617 | 163 | 1189 | 469 |
| 2/6/2025 | 398 | 579 | 213 | 1190 | 429 |
| 1/30/2025 | 512 | 491 | 170 | 1173 | 359 |
| 1/23/2025 | 423 | 544 | 200 | 1167 | 403 |
| 1/16/2025 | 202 | 446 | 217 | 865 | 404 |
| 1/9/2025 | 276 | 448 | 180 | 904 | 445 |
| 1/2/2025 | 340 | 459 | 155 | 954 | 384 |
| Last 6 months of 2024 | |||||
| DBA’s | Incs & LLC’s | Combined Alcohol And Permits | Total Raw | Total Net Issued | |
| 12/19/2024 | 318 | 540 | 144 | 1002 | 344 |
| 12/12/2024 | 403 | 404 | 263 | 1070 | 559 |
| 12/5/2024 | 438 | 556 | 230 | 1224 | 448 |
| 11/21/2024 | 322 | 384 | 179 | 885 | 396 |
| 11/14/2024 | 340 | 271 | 184 | 795 | 370 |
| 11/7/2024 | 382 | 722 | 166 | 1270 | 479 |
| 10/31/2024 | 359 | 766 | 183 | 1308 | 450 |
| 10/24/2024 | 683 | 736 | 210 | 1629 | 607 |
| 10/17/2024 | 355 | 614 | 176 | 1145 | 502 |
| 10/10/2024 | 455 | 731 | 235 | 1421 | 575 |
| 10/3/2024 | 426 | 624 | 229 | 1279 | 581 |
| 9/26/2024 | 445 | 637 | 194 | 1275 | 499 |
| 9/19/2024 | 469 | 756 | 158 | 1383 | 513 |
| 9/12/2024 | 515 | 757 | 209 | 1481 | 608 |
| 9/5/2024 | 489 | 637 | 185 | 1311 | 517 |
| 8/29/2024 | 334 | 459 | 165 | 958 | 287 |
| 8/22/2024 | 389 | 769 | 157 | 1315 | 472 |
| 8/15/2024 | 587 | 812 | 172 | 1571 | 583 |
| 8/8/2024 | 433 | 711 | 168 | 1312 | 464 |
| 8/1/2024 | 449 | 616 | 217 | 1282 | 535 |
| 7/25/2024 | 467 | 748 | 193 | 1408 | 507 |
| 7/18/2024 | 428 | 807 | 195 | 1430 | 559 |
Complementary File Sample
Seeking to know and understand new restaurants prior to opening? Contact us and we’ll send a complementary week in .CSV or PDF format.